Regression Curve Calculator
Find the perfect model for your data. Simultaneously analyze linear, quadratic, exponential, and logarithmic curves to identify the optimal mathematical fit with unparalleled precision.
Regression Curve Calculator
Compare linear, quadratic, exponential, and logarithmic regression models side by side. Find the best fit curve for your data with our free online tool.
Select a regression model and enter your data points below
Data Points (X, Y)
| # | X | Y |
|---|
Regression Results
Regression Visualization
Regression Equation
—
R²
0.000
Best Fit Model
—
Predicted Y
—
Model Comparison
| Regression Model Type | Regression Equation | R² | Fit Quality |
|---|
Step-by-Step Solution
How to Use This Regression Curve Calculator
Model Comparison
Fits linear, quadratic, exponential, and logarithmic curves simultaneously.
Enter X & Y Data
Input paired data points — the calculator runs all four models at once.
Best-Fit Ranking
Compare R² values side-by-side and identify the best-fitting model.
Best For
Exploratory analysis when you're unsure which regression model fits best.
The highest R² doesn't always mean the best model — consider theoretical justification and simplicity too.
What Is Regression Curve Analysis?
Regression curve analysis is the process of fitting multiple mathematical models to the same dataset and comparing how well each model captures the underlying pattern. Unlike single-model regression — where you commit to one equation form before seeing the results — regression curve analysis lets the data speak for itself by testing several candidate models objectively.
The four most common regression models compared in curve analysis are linear (y = mx + b), quadratic (y = ax² + bx + c), exponential (y = a · e^(bx)), and logarithmic (y = a + b · ln(x)).
Each model represents a fundamentally different relationship between the variables: linear assumes a constant rate of change, quadratic allows acceleration or deceleration with one turning point, exponential captures multiplicative growth or decay, and logarithmic models diminishing returns where the rate of change slows as the independent variable increases.
The primary metric for comparing these models is R² (the coefficient of determination), which measures the proportion of variance in the dependent variable explained by each model. A higher R² indicates a better fit, meaning the model's predicted values track the observed data more closely.
Think of regression curve analysis like trying different keys in a lock: you could try each key one at a time, but it is far more efficient to test them all at once and see which one turns. Similarly, instead of running four separate regression analyses, this calculator runs them simultaneously and immediately identifies which model best fits your data.
This approach is particularly valuable when you are working with an unfamiliar dataset and do not have prior knowledge about which functional form the relationship should take. It is also useful for validating assumptions — if you expect a linear relationship but the quadratic model has a substantially higher R², the data is telling you that the relationship curves.
By comparing models side-by-side with R² as the arbiter, regression curve analysis removes subjective bias from model selection and ensures you choose the model that best represents the true pattern in your data.
Regression Model Types Compared
Understanding the four regression model types is essential for interpreting the results of this calculator. Each model captures a distinct pattern in data, and choosing the wrong one can lead to inaccurate predictions and misleading conclusions. Below is a detailed breakdown of each model type.
Linear Regression (y = mx + b)
The linear regression model assumes a constant rate of change between the variables. Every unit increase in X produces the same change in Y, regardless of where you are on the curve. Visually, this produces a straight line. Linear regression is the simplest and most interpretable model — the slope m tells you exactly how much Y changes per unit of X, and the intercept b tells you the predicted Y when X equals zero. Use linear regression when your scatter plot shows a roughly straight-line trend with no obvious curvature. It is the default starting point for most analyses because of its simplicity and transparency. However, if the data actually curves, a linear model will systematically overpredict in some regions and underpredict in others.
Quadratic Regression (y = ax² + bx + c)
The quadratic regression model adds a squared term that allows the rate of change itself to change, producing a parabolic curve with exactly one turning point (the vertex). When a > 0, the parabola opens upward (U-shaped); when a < 0, it opens downward (inverted-U). This model is ideal when your data shows a clear peak or valley — for example, projectile height over time, crop yield versus fertilizer amount, or performance versus stress level. Quadratic regression captures acceleration and deceleration patterns that a straight line simply cannot represent. The vertex of the parabola often has direct practical significance, indicating the optimal value of the independent variable.
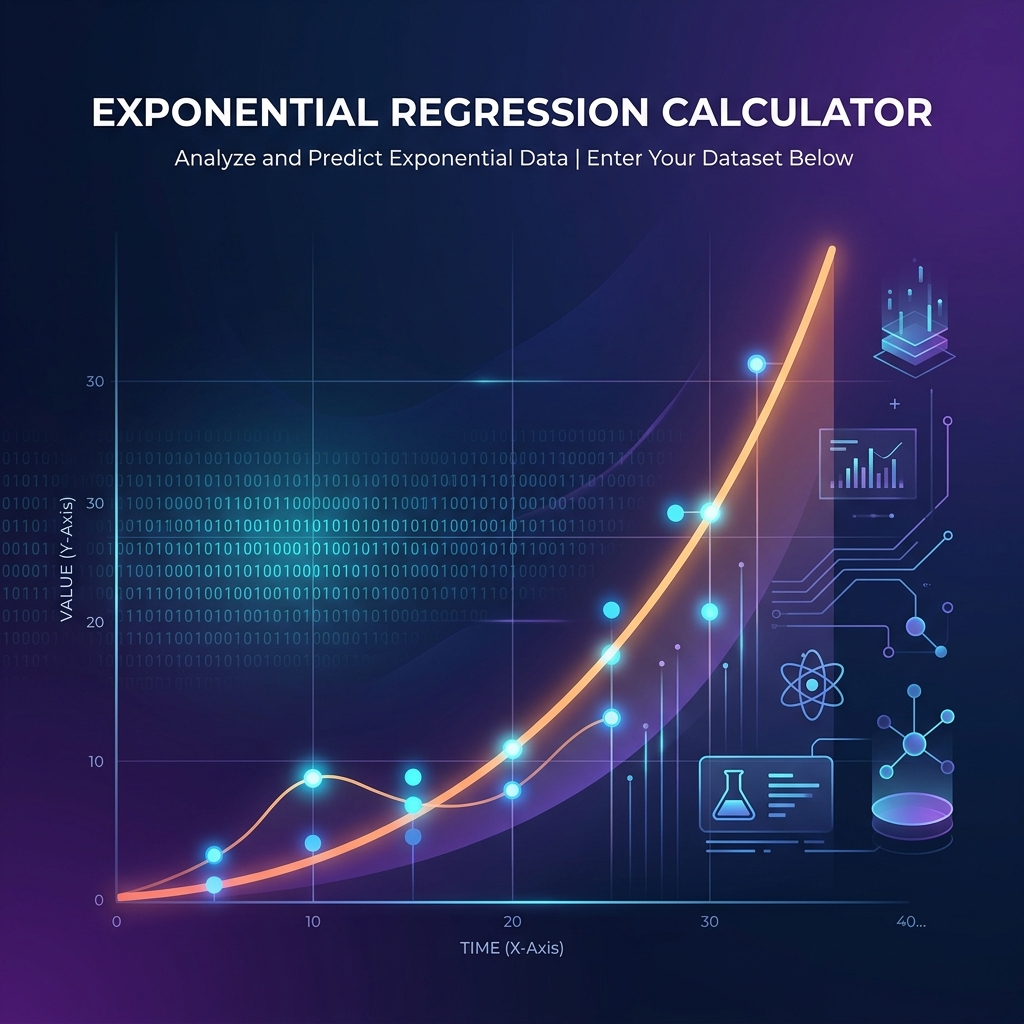
Exponential Regression (y = a · e^(bx))
The exponential regression model captures multiplicative growth or decay, where the rate of change is proportional to the current value. When b > 0, the curve accelerates upward without bound (growth); when b < 0, it decelerates toward zero (decay). This pattern appears naturally in population dynamics, compound interest, radioactive decay, bacterial growth, and technology adoption curves. Unlike quadratic regression, exponential curves never turn around — they keep increasing (or decreasing) forever. Use exponential regression when the scatter plot shows an accelerating upward trend or a decelerating downward approach to zero. A constant ratio between successive Y values is a strong numerical indicator of exponential behavior.
Logarithmic Regression (y = a + b · ln(x))
The logarithmic regression model captures diminishing returns — the relationship increases (or decreases) rapidly at first, then the rate of change slows as X grows larger. The curve is steep on the left side and flattens out toward the right, approaching a horizontal asymptote. This pattern is common in many real-world scenarios: the benefit of additional study hours decreases as you study more, the impact of additional advertising spend plateaus as saturation is reached, and skill acquisition slows with practice. Logarithmic regression requires all X values to be positive (since ln(x) is undefined for x ≤ 0). Use this model when early changes are large and later changes are small — the classic diminishing-returns pattern.
| Model | Equation | Best Use Case | Visual Shape |
|---|---|---|---|
| Linear | y = mx + b | Constant rate of change | Straight line |
| Quadratic | y = ax² + bx + c | Parabolic acceleration/deceleration | Parabola (U or inverted-U) |
| Exponential | y = a · e^(bx) | Multiplicative growth or decay | Accelerating curve up or decelerating curve down |
| Logarithmic | y = a + b · ln(x) | Diminishing returns, rapid initial change | Steep then flattening curve |
| Linear example | y = 2x + 5 | Temperature vs time (constant rate) | Diagonal line |
| Quadratic example | y = −x² + 6x − 3 | Projectile height vs time | Inverted U |
| Exponential example | y = 3 · e^(0.5x) | Bacteria population over time | Upward accelerating curve |
| Logarithmic example | y = 5 + 4 · ln(x) | Skill vs practice time | Steep rise then plateau |
Linear vs Quadratic vs Exponential vs Logarithmic Regression
When should you choose one regression model over another? This section provides a head-to-head comparison of all four models to help you understand their relative strengths and weaknesses in specific scenarios.
When Linear Beats Quadratic
If the true relationship is approximately straight, the linear model is preferable even when the quadratic model has a marginally higher R². The quadratic model adds an extra parameter (three coefficients vs. two), which increases complexity without providing meaningful improvement. Linear models are more interpretable, more stable with small samples, and produce safer extrapolations. Choose linear when the quadratic model's R² is less than 0.03 higher than the linear model's R².
When Quadratic Beats Linear
When the scatter plot shows a clear curve with a single peak or valley, the quadratic model captures the pattern that linear regression misses entirely. The improvement in R² is usually substantial (0.1 or more), and the vertex provides the practically important optimal X value. Common examples include projectile trajectories, cost curves, and dose-response relationships where output rises then falls (or vice versa).
When Exponential Beats Logarithmic
Exponential regression outperforms logarithmic when the data shows accelerating growth without any plateau — the curve rises faster and faster as X increases. Logarithmic regression, by contrast, assumes diminishing returns where growth slows. If the data is clearly accelerating (Y values increase by larger and larger increments), exponential is the right choice. Population growth, compound interest, and bacterial spread are classic examples where exponential beats logarithmic.
When Logarithmic Beats Exponential
Logarithmic regression wins when the data shows rapid initial change that gradually levels off — the opposite of exponential behavior. If Y increases quickly at first and then the increments get smaller and smaller, the logarithmic curve captures this diminishing-returns pattern. Exponential regression would incorrectly predict accelerating growth. Ad spend vs. conversions, practice time vs. skill level, and study hours vs. test scores often follow this pattern.
When Quadratic Beats Exponential
The quadratic model beats exponential when the data has a clear turning point — the trend reverses direction at some X value. Exponential curves never reverse; they keep growing (or decaying) forever. If your data rises then falls (or falls then rises), the parabola is the natural choice. Exponential regression would either miss the turnaround entirely or produce a very poor fit trying to force an accelerating curve through data that eventually declines.
When No Single Model Dominates
Sometimes two or more models have very similar R² values (within 0.02–0.03). In these cases, the data may not contain enough information to distinguish between the models, or the true relationship may fall between the functional forms these models represent. In such situations, prefer the simplest model (linear first, then logarithmic, then quadratic, then exponential) unless domain knowledge strongly favors a more complex form. You can also collect more data to help resolve the ambiguity — additional data points often make the R² differences clearer.
| Feature | Linear | Quadratic | Exponential | Logarithmic |
|---|---|---|---|---|
| Equation | y = mx + b | y = ax² + bx + c | y = a · e^(bx) | y = a + b · ln(x) |
| Parameters | 2 (m, b) | 3 (a, b, c) | 2 (a, b) | 2 (a, b) |
| Best pattern | Constant rate | Single peak or valley | Accelerating growth/decay | Diminishing returns |
| Pros | Simple, interpretable, safe extrapolation | Captures curvature, finds optimal X | Natural for growth/decay processes | Captures leveling-off patterns |
| Cons | Misses all curvature | Can overfit, diverges on extrapolation | Never turns around, requires positive Y | Requires positive X, cannot model acceleration |
| Typical R² range | 0.30–0.90 | 0.50–0.98 | 0.40–0.98 | 0.50–0.99 |
| Common fields | Economics, calibration | Physics, optimization | Biology, finance | Marketing, education |
Understanding R-Squared and Model Comparison
R-squared (R²) is the cornerstone metric for comparing regression models in this calculator. It measures the proportion of variance in the dependent variable Y that is explained by the regression model, ranging from 0 to 1. An R² of 1 means the model perfectly predicts every data point; an R² of 0 means the model explains none of the variability — it does no better than simply using the mean of Y as the prediction for every observation.
When comparing models in regression curve analysis, R² serves as an objective arbiter. The model with the highest R² captures the most variance and is generally the best choice for prediction. However, there are important nuances to understand.
Comparing R² across model types is valid when all models are fit to the same data using least squares, as this calculator does. However, be aware that models with more parameters (quadratic has 3 coefficients vs. linear's 2) have an inherent advantage — they can always fit at least as well as simpler models. This is where the concept of adjusted R² becomes relevant. Adjusted R² penalizes for the number of parameters, so if a quadratic model's R² is only marginally higher than the linear model's, the adjusted R² may actually favor the simpler linear model. When two models have similar R² values (within about 0.02–0.03), prefer the simpler model unless domain knowledge justifies the added complexity.
Overfitting is a real concern when comparing models. A model with many parameters can achieve a high R² on the training data by fitting noise rather than the true underlying pattern. This is especially problematic with small datasets (fewer than 10 points). If the quadratic or exponential model has a dramatically higher R² than linear, the improvement is likely genuine. But if the difference is small, the simpler model may actually predict new data more reliably.
When to trust the best-fit recommendation: The calculator's automatic best-fit selection is most reliable when (1) you have at least 10 data points,
(2) the winning model's R² is substantially higher than the runner-up (by at least 0.05), and
(3) the winning model's functional form makes substantive sense for the relationship being studied. If the R² values are very close, consider reporting multiple models and letting domain knowledge guide the final choice.
| R² Range | Interpretation |
|---|---|
| 0.90–1.00 | Excellent fit — model explains nearly all variance |
| 0.70–0.89 | Good fit — model captures main trend well |
| 0.50–0.69 | Moderate fit — consider other models or more data |
| Below 0.50 | Poor fit — try a different model type |
Choosing the Right Regression Model for Your Data
Selecting the appropriate regression model is one of the most important decisions in data analysis. The wrong model can produce inaccurate predictions, misleading interpretations, and flawed conclusions. This section provides a decision-tree approach to help you choose the right model before — or in addition to — using this calculator's automatic R² comparison.
Decision Tree for Model Selection
Is the relationship approximately straight? If your scatter plot shows data points clustering around a straight line with no obvious curvature, linear regression (y = mx + b) is the right choice. Linear models are the simplest to interpret, the most widely used, and the least prone to overfitting. The slope tells you the constant rate of change, and predictions are reliable within the data range. Use linear regression as your default unless the data clearly curves.
Does the relationship curve once (peak or valley)? If your scatter plot shows a single turning point — data rises then falls, or falls then rises — quadratic regression (y = ax² + bx + c) is appropriate. The parabola captures acceleration followed by deceleration (or vice versa). The vertex identifies the optimal X value. Common examples include projectile motion, dose-response relationships, and cost curves. If the data curves but never turns around (always increasing at an increasing rate), consider exponential instead.
📉 Does the relationship grow or decay at an accelerating rate? If Y increases faster and faster as X grows (or decreases slower and slower toward zero), exponential regression (y = a · e^(bx)) is the right model. This captures multiplicative change where each unit increase in X produces a proportionally larger change in Y. Common in population growth, compound interest, radioactive decay, and epidemic modeling. A constant ratio between successive Y values (e.g., each Y is about 1.5 times the previous one) is a strong indicator of exponential behavior.
Does the relationship change quickly at first, then slow down? If the scatter plot shows a steep initial rise that gradually flattens out — the classic diminishing returns pattern — logarithmic regression (y = a + b · ln(x)) is the best choice. This pattern appears whenever additional input produces progressively smaller improvements: additional study hours, extra advertising spend, more practice sessions, or further rounds of editing. The logarithmic curve captures the fact that the biggest gains come early and later increments yield less and less improvement.
Are you uncertain about the pattern? When you are unsure which model fits best — especially with an unfamiliar dataset — that is exactly when this regression curve calculator is most valuable. Let the R² comparison guide your choice objectively rather than guessing. The calculator removes the bias of assuming a particular model form and lets the data reveal its own structure.
Domain-Specific Considerations
Beyond visual inspection, domain knowledge should inform model selection. In finance, stock returns are often log-normally distributed, favoring exponential or logarithmic models. In physics, many relationships are linear (Hooke's law, Ohm's law) or quadratic (kinematics). In biology, growth patterns are frequently exponential in early phases and logarithmic as carrying capacity is approached. In engineering, stress-strain curves are linear up to a yield point and then parabolic. Always combine statistical evidence (R²) with subject-matter understanding for the most robust model selection.
| Data Pattern | Recommended Model | Why |
|---|---|---|
| Straight line trend | Linear (y = mx + b) | Constant rate of change |
| Single curve or peak | Quadratic (y = ax² + bx + c) | Parabolic acceleration/deceleration |
| Accelerating growth or decay | Exponential (y = a·e^(bx)) | Multiplicative rate of change |
| Rapid initial change then plateau | Logarithmic (y = a + b·ln(x)) | Diminishing returns pattern |
| Uncertain or complex | Compare all models | Let R² guide your choice |
When to Use Regression Curve Analysis
Regression curve analysis is the right approach whenever you need to identify the best-fitting model from multiple candidates rather than committing to a single model form in advance. Specific scenarios where this tool excels include:
- Exploring new datasets: When you encounter data for the first time and have no prior knowledge about the relationship's shape, comparing all four models simultaneously gives you an immediate, objective read on the pattern.
- Validating assumptions: If you have been using a linear model but suspect the relationship may be nonlinear, this calculator confirms or refutes your assumption with R² evidence.
- Academic assignments: Statistics courses often require comparing regression models. This tool produces the side-by-side comparison, R² values, and visualizations needed for thorough model comparison reports.
- Business forecasting: When selecting a model for revenue projections, demand forecasting, or resource planning, choosing the wrong model can lead to costly errors. Comparing models objectively reduces this risk.
- Scientific research: Before publishing, researchers must justify their model choice. A systematic comparison of multiple models with R² rankings provides the evidence reviewers expect.
Industry-specific applications further illustrate the value of regression curve analysis. In finance, analysts compare linear versus exponential models for stock price trends. In biology, researchers test logistic versus exponential models for population dynamics. In engineering, stress-strain relationships are evaluated as linear versus quadratic.
In marketing, ad spend versus conversion is often a diminishing-returns (logarithmic) pattern. In education, study time versus scores frequently follows a logarithmic or linear fit depending on the subject matter and student population. In each of these domains, using the wrong model can lead to incorrect conclusions — regression curve analysis provides the statistical evidence needed to choose correctly.
| Industry | Use Case | Example |
|---|---|---|
| Finance | Stock price trends | Comparing linear vs exponential growth |
| Biology | Population dynamics | Testing logistic vs exponential models |
| Engineering | Stress-strain curves | Linear vs quadratic material response |
| Marketing | Ad spend vs conversion | Diminishing returns (logarithmic) |
| Education | Study time vs scores | Comparing linear and logarithmic fits |
Frequently Asked Questions
What Is a Regression Curve Calculator?
A regression curve calculator is a tool that fits multiple regression models to your data simultaneously and compares their goodness of fit using R². Unlike a single-model calculator that only computes one equation type, a regression curve calculator runs linear, quadratic, exponential, and logarithmic regressions at the same time and ranks the results so you can immediately identify the best-fit curve. This eliminates the need to test each model separately and removes guesswork from model selection.
How Does Regression Curve Analysis Work?
Regression curve analysis works by fitting several mathematical models to the same dataset and comparing how well each model explains the observed variation.
For each candidate model, the calculator uses the least squares method to find the coefficients that minimize the sum of squared residuals. It then computes R² for each model on the original data and ranks them. The model with the highest R² captures the most variance and is identified as the best fit. The entire process runs automatically in one click.
What Regression Models Does This Calculator Compare?
This calculator compares four regression models: linear (y = mx + b), quadratic (y = ax² + bx + c), exponential (y = a · e^(bx)), and logarithmic (y = a + b · ln(x)). These four models cover the most common functional relationships in statistics, science, and engineering — constant-rate change, parabolic curves with one turning point, multiplicative growth/decay, and diminishing-returns patterns.
How Do I Find the Best Fit Regression Curve?
To find the best fit regression curve, enter your data points into this calculator and click Calculate. The tool automatically fits all four models and ranks them by R². The model with the highest R² is the best statistical fit. However, also consider whether the winning model's functional form makes substantive sense for your data — a slightly lower R² with a more interpretable model may sometimes be preferable, especially when R² values are close (within 0.02–0.03).
What Is R-Squared and How Do I Interpret It?
R-squared (R²) measures the proportion of variance in Y explained by the regression model, ranging from 0 to 1. An R² of 0.85 means the model explains 85% of the variability in the data.
Higher R² indicates a better fit: above 0.90 is excellent, 0.70–0.89 is good, 0.50–0.69 is moderate, and below 0.50 suggests the model may not be appropriate. When comparing models in this calculator, the highest R² identifies the best-fit curve. Use our Pearson correlation calculator to assess the linear association strength that underlies these R² values.
Can I Compare More Than One Regression Model at Once?
️ Yes — that is the primary purpose of this regression curve calculator. It fits all four models simultaneously and displays them side-by-side in a comparison table with R² values, equations, and a visual overlay. You do not need to run separate calculations for each model type. The calculator handles everything in a single click, making it far more efficient than testing models individually.
What Is the Difference Between Linear and Quadratic Regression?
Linear regression fits a straight line (y = mx + b) that assumes a constant rate of change between variables.
Quadratic regression fits a parabola (y = ax² + bx + c) that allows the rate of change itself to change, producing a curve with one peak or valley. Quadratic regression has three coefficients instead of two, giving it more flexibility to capture curved patterns. Use linear when the scatter plot shows a straight trend; use quadratic when there is a visible curve or turning point.
When Should I Use Exponential Regression Instead of Linear?
Use exponential regression when your data shows accelerating growth or decelerating decay — where the rate of change is proportional to the current value. In contrast, linear regression assumes a constant rate of change.
If each unit increase in X produces a larger change in Y than the previous unit (or a smaller change in the case of decay), exponential is more appropriate. A constant ratio between successive Y values (e.g., Y doubles each time) is a strong indicator that exponential regression should be used instead of linear.
What Is Logarithmic Regression Used For?
Logarithmic regression is used to model diminishing returns — situations where the rate of change decreases as the independent variable increases. The curve rises steeply at first and then flattens out. Common applications include the relationship between study time and test scores (big gains early, smaller gains later), advertising spend and conversions (initial spend is most effective), practice and skill level, and many natural saturation processes. Logarithmic regression requires all X values to be positive.
How Many Data Points Do I Need for Regression Curve Analysis?
The mathematical minimum is 2 data points for linear regression, 3 for quadratic, and additional points for exponential and logarithmic models. However, for meaningful model comparison, you should have at least 10 data points. With fewer than 5–6 points, R² values are unreliable, and the model ranking may not reflect the true underlying pattern. For robust results, especially when R² values are close, aim for 15–20 or more observations.
What If Multiple Models Have Similar R-Squared Values?
When two or more models have R² values within about 0.02–0.03 of each other, the data does not provide enough evidence to distinguish between them decisively. In this situation, prefer the simpler model (linear over quadratic, and two-parameter models over three-parameter models) unless domain knowledge strongly favors a more complex form. You can also collect more data to resolve the ambiguity — additional data points often make the R² differences more pronounced.
Can This Calculator Handle Negative Values?
Yes, with one exception. The linear and quadratic models handle negative X and Y values without any issue. However, exponential regression requires positive Y values (because ln(y) is undefined for y ≤ 0) and logarithmic regression requires positive X values (because ln(x) is undefined for x ≤ 0). If your data contains zero or negative values that would violate these requirements, the affected model is automatically skipped and the remaining models are still compared.
How Accurate Are the Regression Curve Predictions?
The accuracy of regression predictions depends on several factors: the R² of the model (higher R² means more accurate predictions), the distance from the prediction point to the center of the data (predictions near the mean of X are more reliable), and whether you are interpolating or extrapolating. Interpolated predictions (within the observed X range) with R² above 0.90 are typically quite accurate. Extrapolated predictions should be treated with caution regardless of R².
What Is the Best Regression Model for Growth Data?
For growth data, the best model depends on the growth pattern. Exponential regression is best for accelerating, unconstrained growth (populations, compound interest, bacterial spread). Logarithmic regression is best for growth that decelerates (diminishing returns, saturation effects). Quadratic regression may fit growth that peaks and then declines. This calculator compares all three growth models simultaneously so you can see which one best matches your specific data pattern.
How Do I Know If My Regression Model Is Overfitting?
Can I Use This Calculator for Polynomial Regression?
This calculator includes quadratic regression (y = ax² + bx + c), which is a degree-2 polynomial. It does not currently support cubic (degree 3) or higher-order polynomial regression. For most practical applications, the four models compared here — linear, quadratic, exponential, and logarithmic — cover the common functional forms. If you specifically need polynomial regression of degree 2, use the quadratic regression calculator for dedicated polynomial output with vertex and axis of symmetry.
What Is the Difference Between Correlation and Regression?
Correlation measures the strength and direction of the linear association between two variables, producing a single number r between −1 and +1. Regression goes further by fitting a predictive equation that allows you to estimate Y from X. Correlation is symmetric (r(X,Y) = r(Y,X)); regression is not. Use the Pearson correlation calculator when you only need to measure association strength; use this regression curve calculator when you need predictive equations and model comparison.
How Do I Export Regression Curve Results?
Can I Compare Regression Models for the Same Dataset?
Yes — that is exactly what this calculator is designed for. It fits all four regression models to the same dataset simultaneously and compares them using R². This side-by-side comparison is more efficient and more objective than running separate calculations for each model type. The comparison table shows each model's equation, R², and fit quality at a glance, and the visualization overlays all four curves on the same scatter plot.
What Should I Do If No Model Fits Well?
If all four models have R² below 0.50, the data may not follow any of the standard functional forms compared here. Possible reasons include: the relationship requires a higher-order polynomial (cubic or beyond), important predictor variables are missing (consider multiple regression with additional predictors), the data contains extreme outliers that distort all fits (use our Grubbs' test calculator to detect them), or the relationship is genuinely noisy with no clear pattern.
Consider collecting more data, removing outliers, or exploring the regression assumptions checker to diagnose the problem.
Is This Regression Curve Calculator Free to Use?
Yes, this regression curve calculator is completely free with no registration, no paywall, and no limits on the number of calculations or data points. All computations run locally in your browser — your data is never sent to any server, ensuring complete privacy. There are no hidden fees, no premium tiers, and no restrictions on features.
How Does This Compare to Excel Regression Tools?
Excel can perform individual regression types (linear via LINEST, exponential via LOGEST) but cannot compare multiple models simultaneously. With Excel, you would need to run each model separately and manually compare R² values — a time-consuming and error-prone process.
🧮 This calculator runs all four models at once, provides an immediate side-by-side comparison with visual overlay, and requires no software installation or spreadsheet setup. It also handles the log transformations for exponential and logarithmic models automatically, whereas Excel requires manual column setup for these.
Can I Use This for Time Series Data?
Yes, you can use this calculator for time series data where time is the independent variable (X). Linear regression captures constant trends, exponential regression captures accelerating growth or decay, and logarithmic regression captures decelerating trends. However, be cautious about autocorrelation — consecutive observations in time series are often correlated, which can inflate R² and make the model appear more reliable than it truly is. For formal testing of autocorrelation, use the Durbin-Watson test available in our regression assumptions checker.
What Are Residuals in Regression Analysis?
Residuals are the differences between observed Y values and the values predicted by the regression model (eᵢ = yᵢ − ŷᵢ). They represent the portion of each data point that the model fails to capture.
Analyzing residuals is essential for validating model fit: a good model produces residuals that are randomly scattered around zero with no systematic pattern. If residuals show a curved pattern, the wrong model was chosen. If they fan out (funnel shape), the data has heteroscedasticity. Always inspect residuals before trusting regression results.
How Do I Cite This Regression Curve Calculator in My Research?
To cite this calculator, use a standard web citation format. For APA style: Regression Equation Calculator. (2026). Regression Curve Calculator — Compare Multiple Models & Find Best Fit. Retrieved from https://RegressionEquationCalculator.com/regression-curve-calculator/. Include the access date and the specific URL. When reporting results from this calculator in a paper, state the model comparison method, list all four R² values, identify the selected model, and note the sample size and data range for full transparency.
Related Regression Calculators
Discover more specialized regression modeling tools.
Unsure which model to pick? Start with our Regression equation calculator to build your first linear baseline.